|
|
|
5.
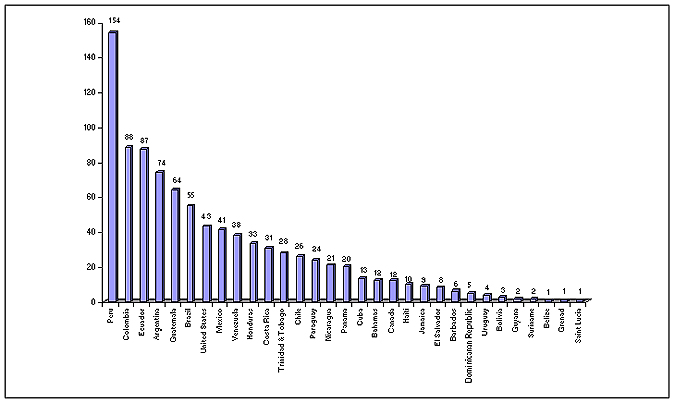
Total number of cases and petitions being processed by country. |
|
|
|
This graph includes the total number of cases and petitions pending before the Commission and their breakdown by OAS member state in descending order by country.
|
|
6.
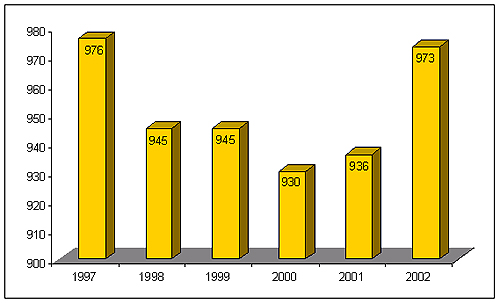
Total number of cases and petitions being processed by year. |
|
|
|
The preceding chart shows the total number of cases and petitions being processed by the Commission in the past six years. |
|
[ Table of Contents | Previous | Next ] |